To analyze a large number of people (two or more people), the Cross Analysis command is used.
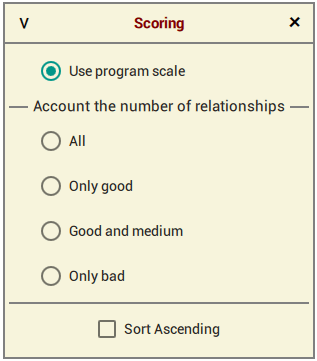
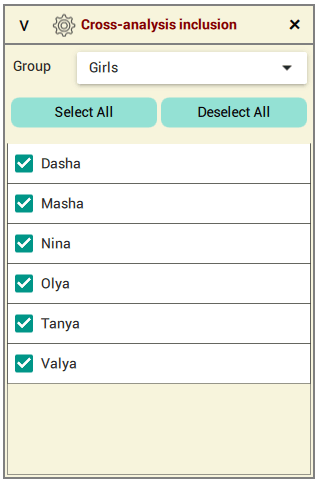
When this command is executed, the Cross-analysis inclusion dialog will be displayed, in which you must first mark all the people, the relationship between whom will be analyzed. In this example, all people from the Girls group and one person (I am) from the Family group are selected. To switch between groups of people, use the Group drop-down list.
Before including the necessary people in the analysis, it is recommended to display the entire list (the Group drop-down list, the All line) and click the Deselect All button. The Select All button allows you to quickly mark all the people shown in the list.
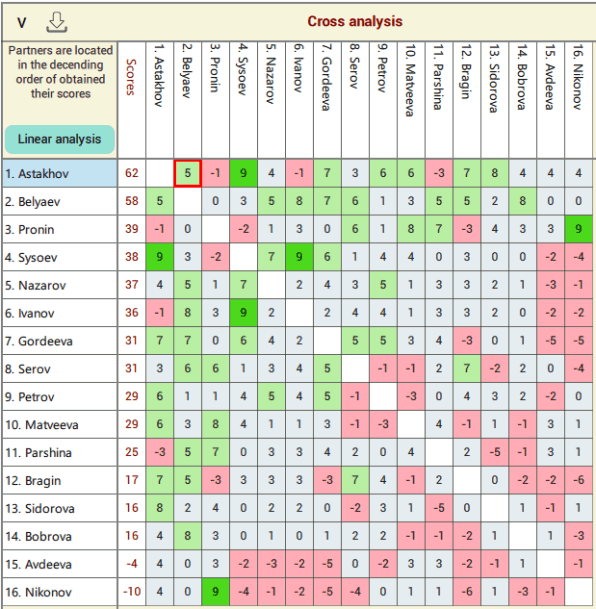
When you click on the "v" button, the program will perform the calculation and display the Cross analysis dialog shown below.
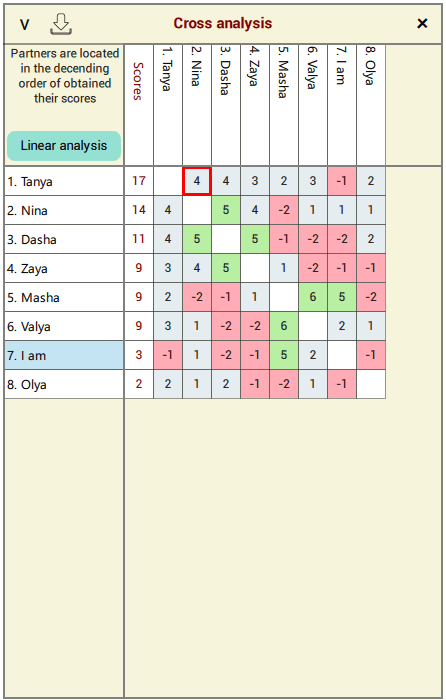
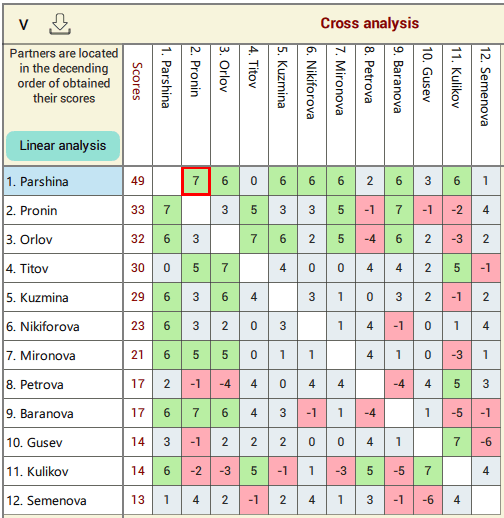
The table displays the overall compatibility score, which can be painted over in one of five colors: green - very good, light green - good, gray - medium, light red - bad, red - very bad. In this example, there are only three colors: light green, gray, light red.
Calculated scores are displayed within each compatibility score. The more points, the better the relationship.
The second column displays the total scores within the current group of people. The higher the score, the better the relationship in the group.
The higher a person is on this list, the better their relationship in the group can develop.
For the selected person (first column), you can get an analysis of relationships with others by clicking on the Linear analysis button.
If you place a red rectangle on the compatibility indicator of interest and press the "v" button, you can analyze in more detail the relationship between two people.
This table can be saved to the application folder by clicking on the second button in the title bar.
All saved tables are available using the "Saved descriptions" command.
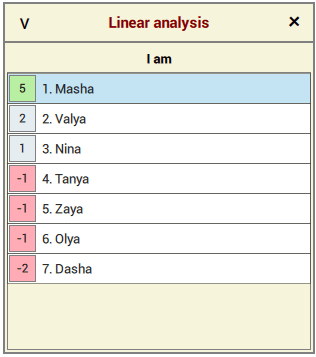
In this case, linear analysis is done for a person with the name I am (indicated above the list) and everyone else. The higher a person is on this list, the better a relationship with them can be. So, the best relationship can develop with Masha, and the worst with Dasha.
If you select the person of interest and press the "v" button, then you can analyze in more detail the relationship between two people.
